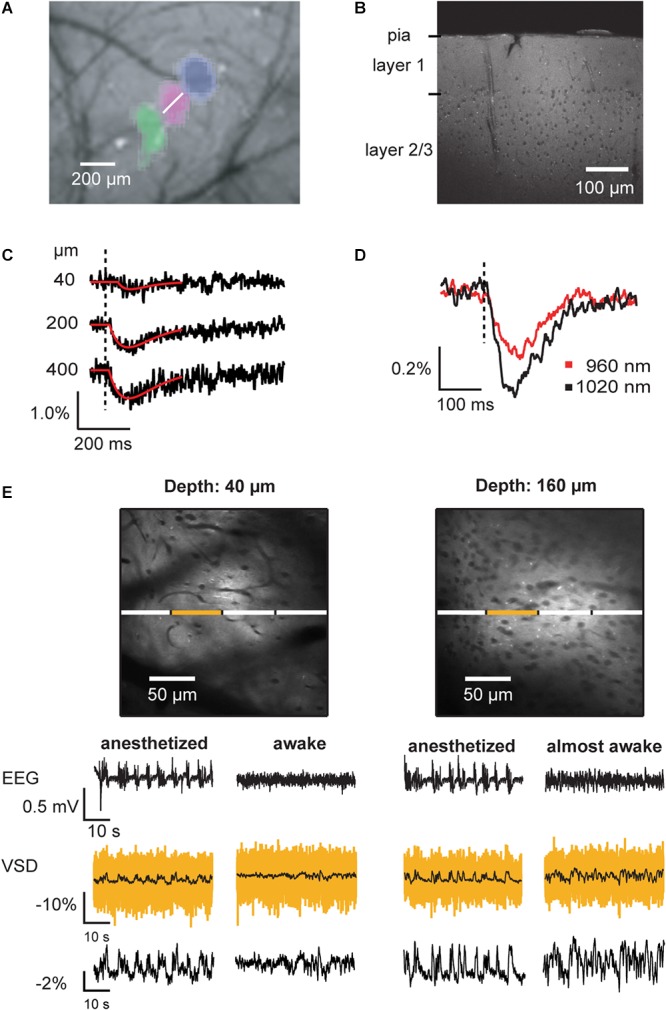
Figure 8.

Voltage imaging of average membrane potential of neuronal tissue in vivo. (A) Imaging of intrinsic signals reveals the location of primary responses in barrel cortex. In this montage, three vibrissa responses (green, magenta, blue) in relation to the blood vessel pattern are shown. Following the imaging of intrinsic signals, the brain region of interest was bulk loaded with VSD. (B) Two-photon image of a barrel cortex brain slice prepared after in vivo bulk-loading with ANNINE-6 shows homogeneous labeling. Somata (here of layer 2/3) and blood vessels remain dark. (C) Two-photon linescans performed at the location indicated in (A) (white line) at different depths below the brain surface were spatially averaged. Vibrissa stimulation causes an average membrane depolarization, which results in decrease of fluorescence if the dye is bound to the outer leaflet of the membrane and the dye is excited at the red spectral absorption edge. (D) Under the same experimental conditions, the excitation wavelength was changed. As expected from a purely electrochromic dye, excitation closer to the spectral edge results in a larger relative fluorescence change. Such an experiment confirms the mechanism of voltage sensing. (E) In vivo two-photon images of cerebral cortex layer 1 and layer 2/3. Blood vessels and somata appear as dark shadows, as the dye is bound to the outer leaflet of the cell membranes. Line scans allow measurement of local average membrane depolarization in anesthetized and awake animals, which correlates with the local electro-encephalogram (EEG). The yellow trace is the averaged trace of the line scan segment indicated above. The black, overlaid trace is the corresponding filtered trace (boxcar smoothing, 200 ms). The segmentation allows analyzing cross-correlations among neighboring brain segments. For example, cross-correlations among segments are higher in anesthetized than in awake animals (Kuhn et al., 2008). The trace at the bottom shows the relative fluorescence change of the full linescan after filtering with 200 ms boxcar smoothing. EEG signals are biphasic, representing sources and sinks while the VSD signal shows average membrane depolarization (negative fluorescence change). As the neuronal activity de-correlates during the transition from anesthetized to awake state, the average voltage signal becomes noisy (160 μm below the dura mater, right VSD traces) and then flat (40 μm, right VSD traces) in the fully awake animal. Average membrane voltage measurements can be recorded for hours without photo bleaching. Copyright (2008) National Academy of Sciences, United States (Kuhn et al., 2008).
