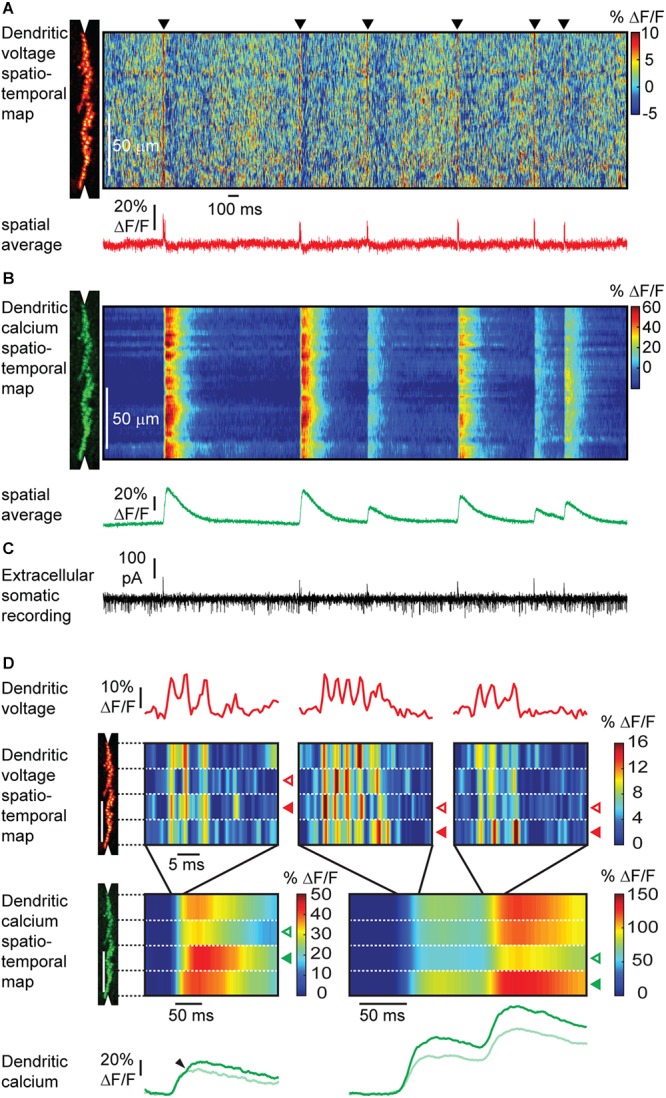
Figure 9.

Simultaneous voltage and calcium imaging of Purkinje neuron dendrites and electric recording from the soma in the awake mouse. (A) A linescan at 2 kHz was taken along the Purkinje neuron dendrite (left) to measure a voltage spatio-temporal map in an awake mouse. Note red vertical lines (black triangles) indicating activation of the full dendritic tree during a complex spike, and background pattern with red ‘hotspots’ indicating localized subthreshold electrical activity. The spatially averaged dendritic voltage trace shows dendritic complex spikes at high SNR. (B) The corresponding dendritic calcium spatio-temporal map shows large transients for every dendritic complex spike. Note the spatial variability of the peak amplitude of calcium transients within single dendritic complex spikes and the amplitude variability between different dendritic complex spikes. (C) The access port allowed simultaneous extracellular electrical recordings from the soma while imaging voltage and calcium transients from the dendrites. Simple spikes (somatic Na+ spikes) result in a current sink at the soma, while complex spikes (dendritic Ca2+ spikes) result in a dominant current source signal at the soma. (D) Different parts of the dendritic tree show a different number of spikelets during the same complex spike event. The number of spikelets correlate with the amplitude of the calcium transients in each part of the dendritic tree. Open arrowheads indicate spatially localized low activity, filled arrowheads high activity. Spatially localized dendritic spikelets during complex spikes correlate with a local boost in the dendritic calcium transient (small arrowheads). Note that the depolarization is caused by the influx of Ca2+. Therefore, the voltage and calcium signal should have the same onset. The observed delay in onset of the calcium signal is the result of the dynamics of the calcium indicator GCaMP6f (Roome and Kuhn, 2018).
