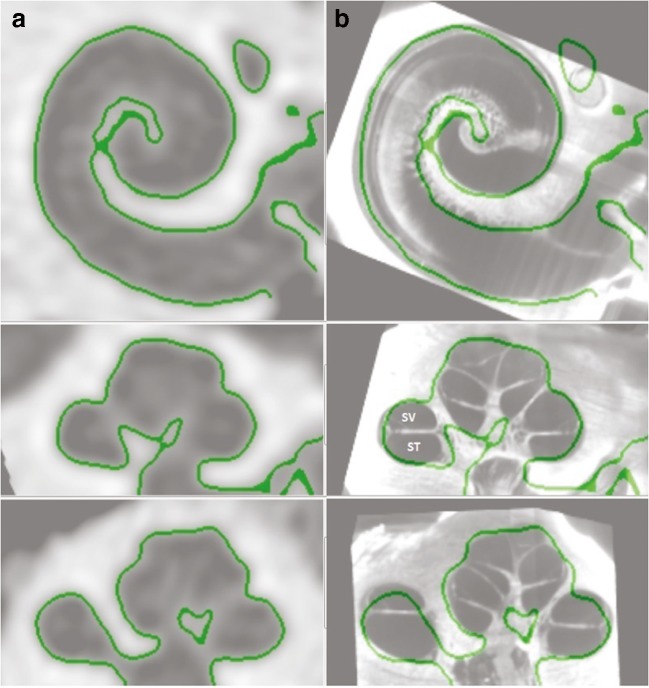
Fig. 1.
Cochlear wall as defined by the computed tomography (CT) scan (column a) and an atlas selected from 10 micro CTs and 1 OPFOS (orthogonal-plane fluorescence optical sectioning) that was aligned by rigid registration to create best fit (column b). SV denotes the estimated location of scala vestibuli and ST denotes the estimated location of scala tympani

