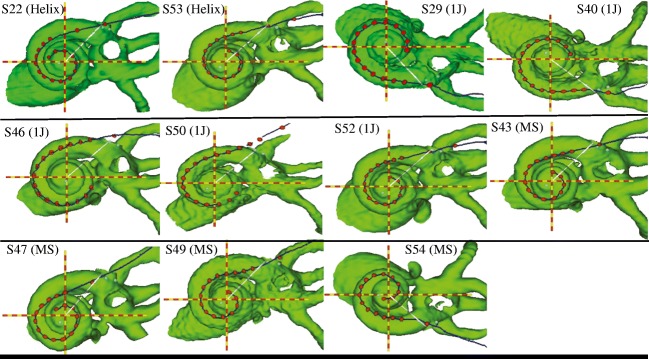
Fig. 2.
3D cochlear reconstructions from all 11 subjects, arranged in order of electrode array type (Helix followed by 1J followed by mid-scala). MS represents the mid-scala array. Red dots represent the electrodes, with the outermost dot representing the insertion depth marker. The red and yellow lines represent the X and Y axes that are used to determine the insertion angle from the white 0° insertion line

