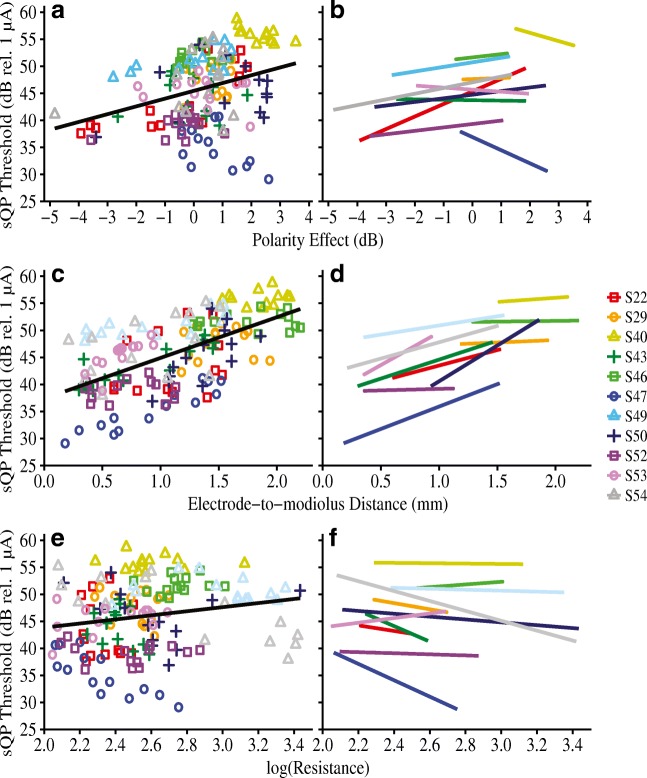
Fig. 5.
Focused (sQP) thresholds (in dB relative to 1 μA) as a function of a, b polarity effect (in dB), c, d electrode-to-modiolus distance (in mm), and e, f log-transformed intracochlear resistance values. Individual subjects are represented by different colors and shapes. In panels a, c, and e, a group regression line is shown in black for ease of visualization. However, note that the black regression line does not account for non-independence of within-subject data. Panels b, d, and f show best-fit lines for individual subjects

