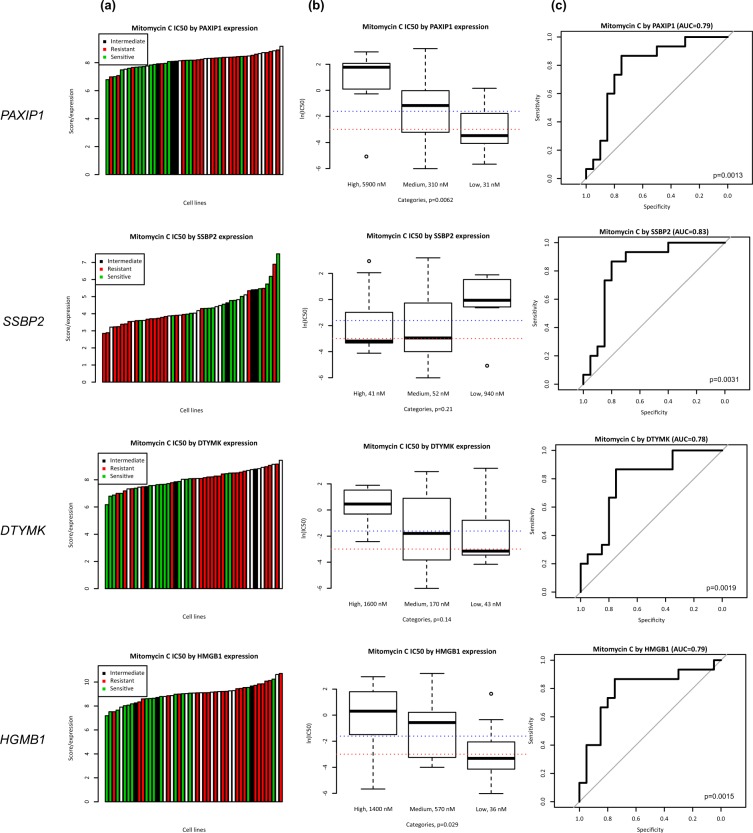
Figure 1.
Correlation between gene expression and Mitomycin-C IC50 in identified molecular markers. (a) Waterfall plot representing distribution of Mitomycin-C sensitivity (resistant IC50 > 200 nM, intermediate IC50 > 50 nM, and sensitive IC50 < 50 nM) across colorectal cancer cell lines ordered by the expression of the respective genes (PAXIP1, SSBP2, DTYMK, HGMB1). (b) Box plot representing IC50 values in cell lines grouped by expression quartiles (high = top quartile, low = bottom quartile, medium = within interquartile range). Dotted lines represent sensitive and resistant cutoffs for IC50 values. (c) Receiver operating characteristic (ROC) curve representing ability of gene expression to correctly classify sensitive or resistant cell lines (PAXIP1 AUC = 0.79, p = 0.0013, SSBP2 AUC = 0.83, p = 0.0031, DTYMK AUC = 0.78, p = 0.0019, and HMGB1 AUC = 0.79, p = 0.0015).

