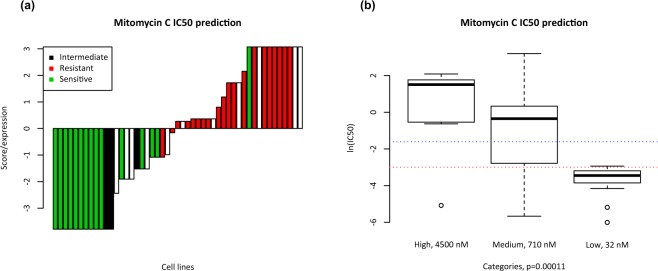
Figure 2.
Combined 4-gene predictive model. (a) Waterfall plot representing distribution of Mitomycin-C sensitivity (resistant IC50 > 200 nM, intermediate IC50 > 50 nM, and sensitive IC50 < 50 nM) across colorectal cancer cell lines ordered by prediction scores from the combined model. (b) Box plot representing IC50 values in cell lines grouped by prediction from the 4-gene prediction model (predictions low = sensitive, high = resistant, medium = intermediate score). Dotted lines represent sensitive and resistant cutoffs for IC50 values.

