Figure 4.

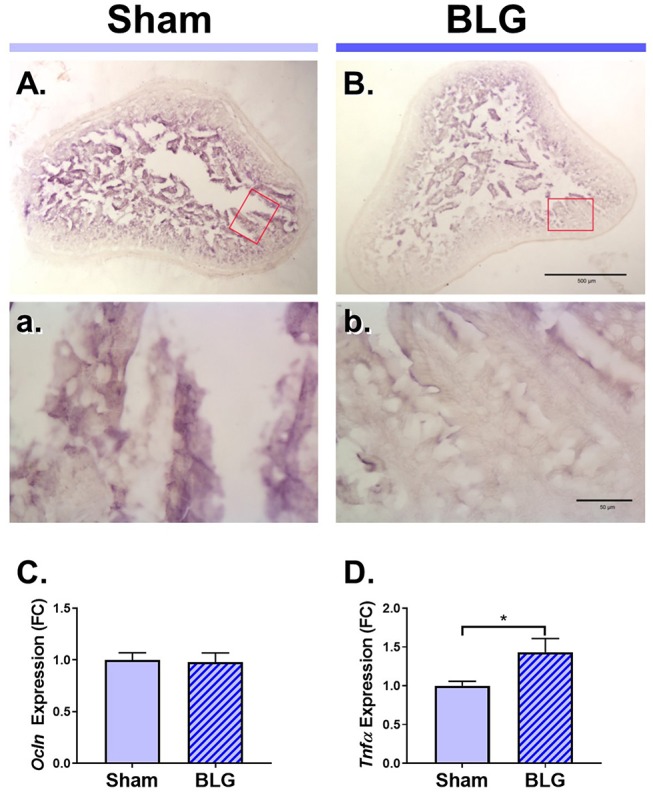
Immunohistochemical detection of occludin and the RT-qPCR assays for Ocln and TNFα expression in the ileum of male sham and BLG mice. Ileal sections (14 μm) from male sham (A,a) and BLG (B,b) mice were immunostained for occludin. The red rectangles in panels (A,B) indicate where the respective higher magnification images, (a) and (b), were taken. The low-magnification (A,B) and high-magnification (a,b) images were taken with a 4X and 40X objectives, respectively. Scale bars: 500 μm for (A) and (B); 50 μm for (a) and (b). The expression levels of Ocln (C) and Tnfα (D) in the ileal tissue samples were also quantitated using RT-qPCR assay. The Cq values for Ocln and Tnfα were normalized to the Cq values of Gapdh (ΔCq) to calculate the expression values (ΔCq = 2−ΔCq). Values shown in the bar graphs are expressed as the fold change (ΔΔCq) ± SEM. *p < 0.05 (unpaired t-test with Welch's correction), n = 6–8.
