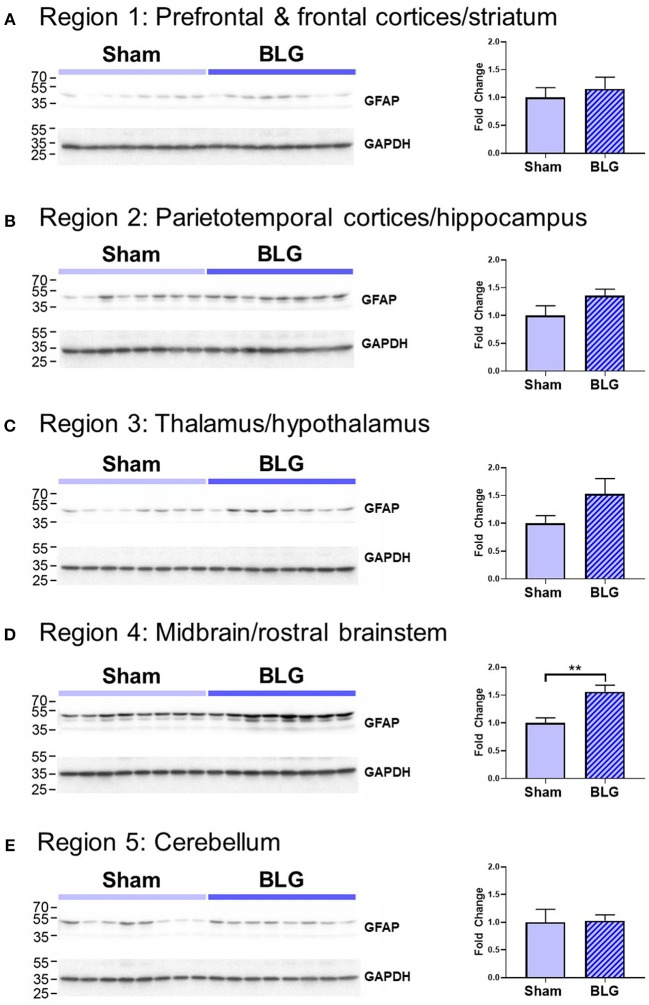
Figure 6.
Western blot analysis of GFAP in the isolated five brain regions. Soluble proteins isolated from the 5 regions were resolved on discontinuous 15% SDS-polyacrylamide gels for western blot detection of GFAP (upper panels). (A) Region 1, (B) Region 2, (C) Region 3, (D) Region 4, and (E) Region 5 as described in Figure 1B. Chemiluminescence signals for GFAP were digitally captured and shown in the upper panels. GAPDH was also detected from the same blots and used as a reference for loading variability (lower panels). The captured GFAP signals were quantified using LI-COR Image Studio Lite software and normalized to GAPDH signals. Values shown in the bar graphs indicate the group average ± SEM. **p < 0.01 (unpaired t-test), n = 8.

