Figure 4.
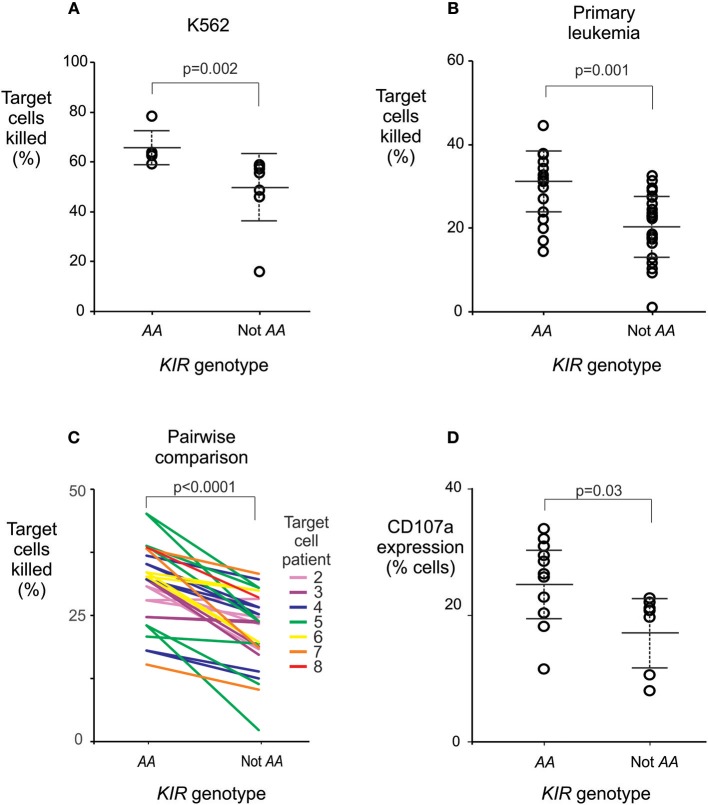
The KIR AA genotype correlates with enhanced potential of NK cells to lyse leukemic cells. (A) Mean % killing of K562 target cells by NK cells isolated from six healthy individuals with (left) and nine without (right) the KIR AA genotype. Each dot represents the mean result from a duplicated assay (Supplemental Figure 3E). P-value is from a Mann-Whitney U-test. (B) Mean % killing of primary leukemia cells using the same NK cells as (A). The primary leukemia targets were obtained from two ALL patients and five AML patients (Supplemental Figure 3). Each dot represents the mean result from a duplicated assay (Supplemental Figure 3). P-value is from a Mann-Whitney U-test. Six NK cell donors were tested against two targets, seven were tested against three targets, and two against four targets, as detailed in Supplemental Figure 3. (C) Pairwise comparisons of % killing by NK cells from KIR AA vs. non AA individuals against identical target leukemia cells. Each line represents one of the seven targets, incubated with NK cells from an AA+ donor (left) or an AA− donor (right), at the same time and conditions. Line colors indicate the seven individual targets as given in Supplemental Figure 3 (Target 1 is K562; not shown for clarity). P-value is from a paired t-test. (D) Shows CD107a expression by NK cells following incubation with K562 targets. The NK cells were isolated from a further 11 healthy individuals with (left) and seven without (right) the KIR AA genotype. P-value is from a Mann-Whitney U-test. Error bars are mean ± sd. The NK killing assays are described in Supplemental Figure 3.

