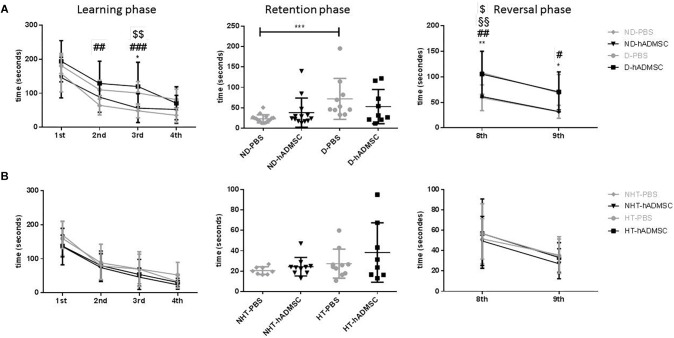
FIGURE 3.
Assessment of long-term spatial memory between D30 and D38 in ND-PBS, untreated non-diabetic mice; ND-hADMSC, treated non-diabetic mice; D-PBS, untreated diabetic mice and D-hADMSC, treated diabetic mice (n = 9–16) (A) and NHT-PBS, untreated non-hypertensive mice; NHT-hADMSC, treated non-hypertensive mice; HT-PBS, untreated hypertensive mice and HT-hADMSC, treated hypertensive mice (n = 8–10) (B). hADMSC did not significantly modify the latency to escape of pMCAo mice whatever the risk factor; ∗p < 0.05, ∗∗p < 0.01, ∗∗∗p < 0.001, ND-PBS versus D-PBS; #p < 0.05, ##p < 0.01, ###p < 0.001, ####p < 0.0001 ND-PBS versus D-hADMSC; §p < 0.05, §§p < 0.01, §§§p < 0.001, §§§§p < 0.0001 ND-hADMSC versus D-PBS; $p < 0.05, $$p < 0.01, $$$p < 0.001, $$$$p < 0.0001 ND-hADMSC versus D-hADMSC.

