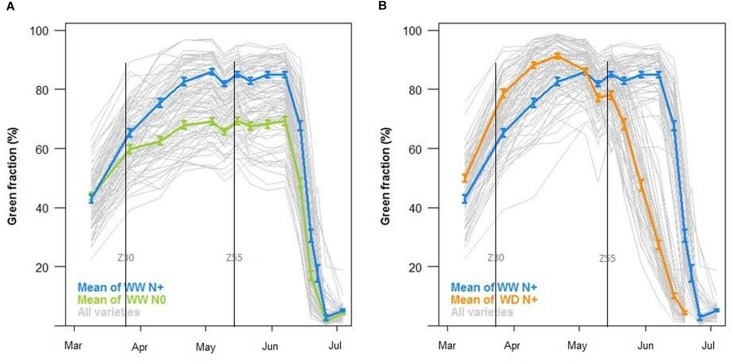
FIGURE 12.
Green fraction (%) during the growing season (A) with the mean of well-watered conditions with nitrogen input (WW N, in blue) against well-watered conditions without nitrogen input (WW N0, in green) and (B) with the mean of well-watered conditions with nitrogen input (WW N, in blue) against water deficient conditions with nitrogen input (WD N+, in orange, N = 44, ±SE) and curves of all varieties (in gray).

