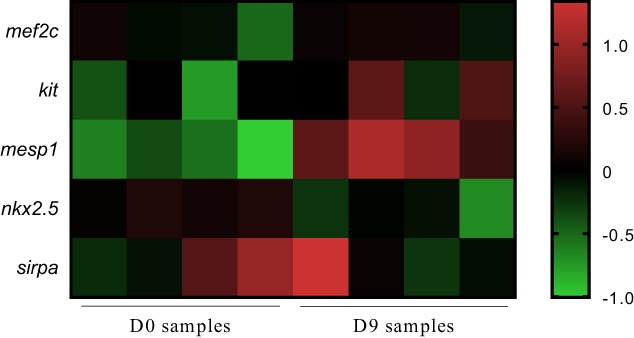
Figure 4.

Average linkage cluster of mRNA expressed in bCD34+ stem cell (SC) and eCD34+ SC. Genes involved in cardiomyocyte differentiation are presented. The color bar is a logarithmic indicator of the fold difference in the expression of each gene from the average, that is, 1 indicates a >1‐fold increase and −1 indicates a <0.5‐fold decrease.
