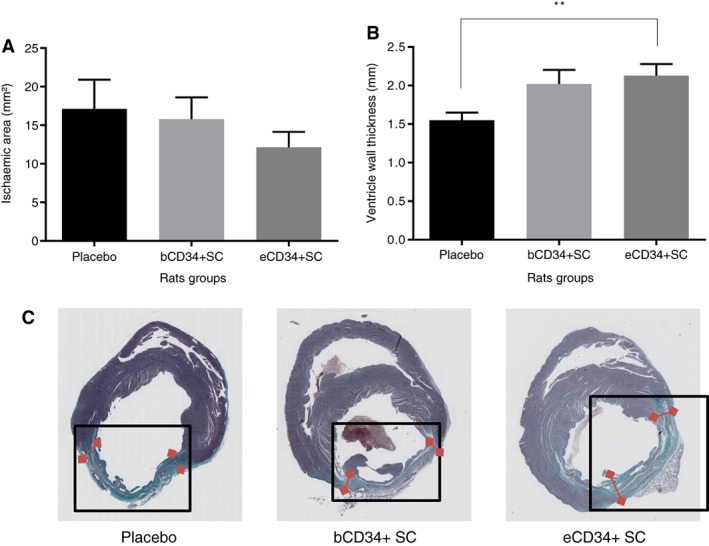
Figure 6.

Comparison of (A) ischemic surface and (B) ventricle wall thickness after placebo (n = 14), bCD34+ stem cell (SC; n = 32), and eCD34+ SC (n = 31) injections. **, p < .01. (C): Illustration of ischemic area size (in green, framed) and ventricle wall thickness (red arrows) among the different groups.
