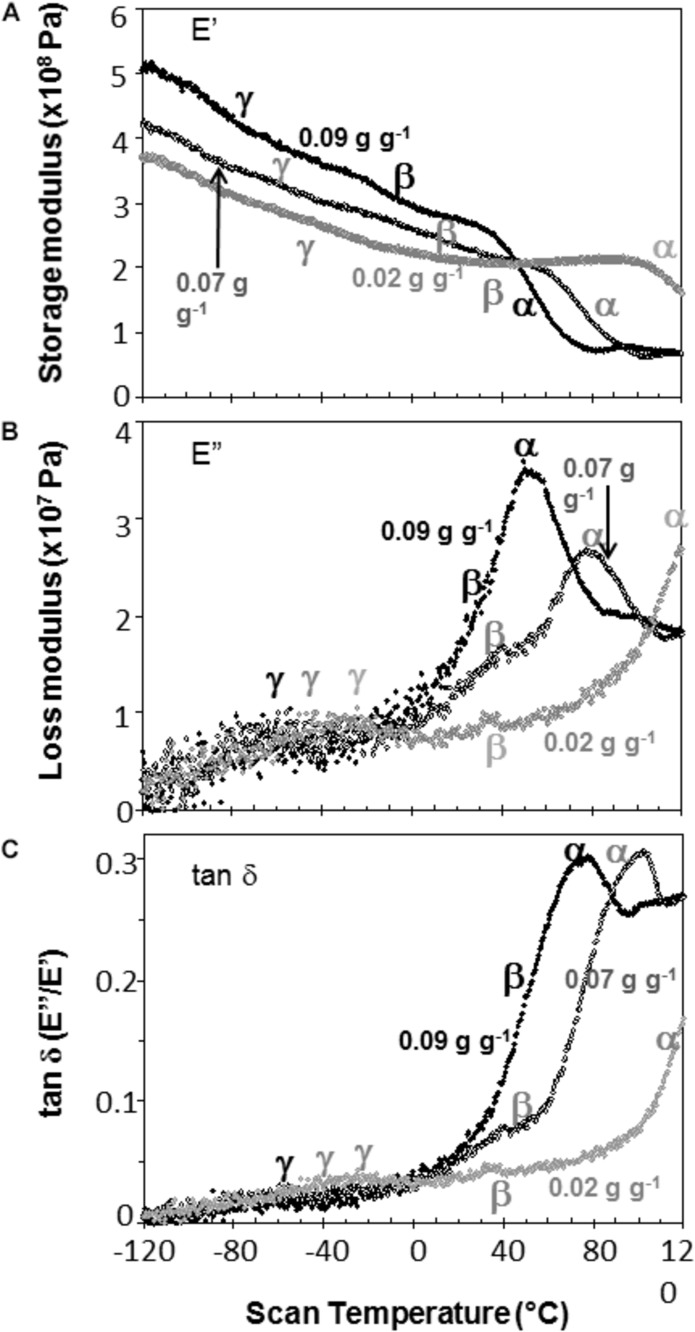
FIGURE 5.
The relationship between temperature and storage modulus (A), loss modulus (B), and tan δ (C) functions in soybean embryonic axes containing 0.09 (black symbols), 0.07 (black, open symbols), and 0.02 (gray symbols) g H2O g–1 dry mass. Relaxation events are as labeled in Figure 3.

