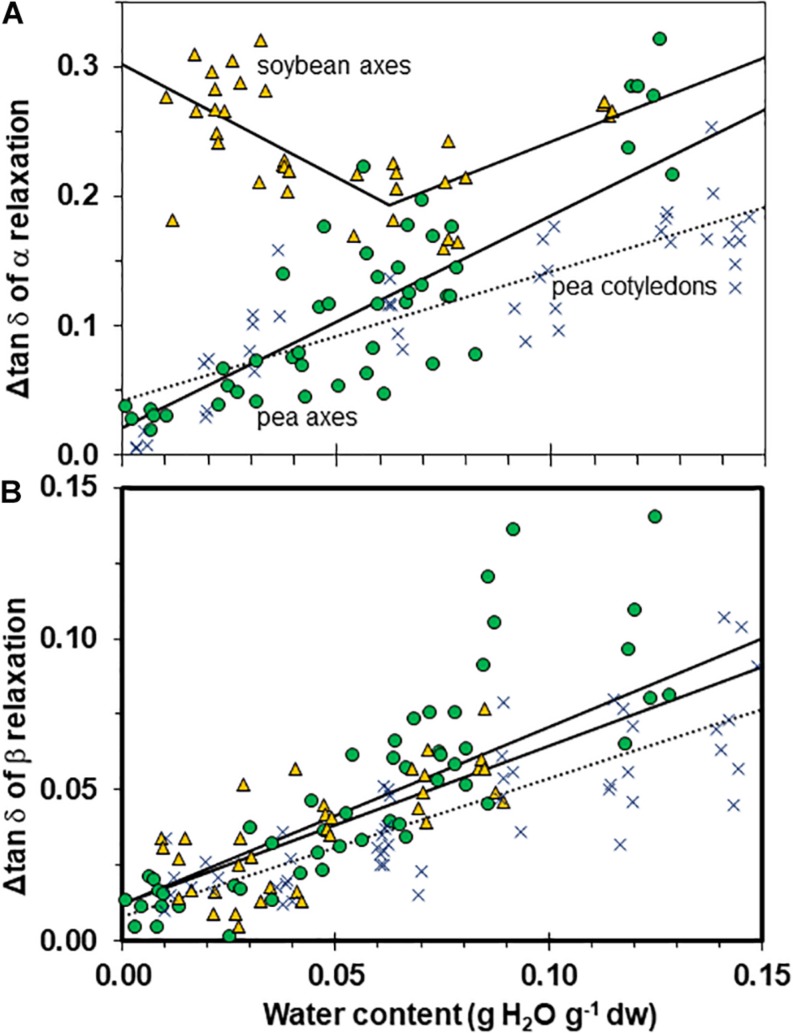
FIGURE 8.
The size of α (A) and β (B) relaxation signals in pea (solid circles) and soybean (open triangles) embryonic axes. Data for pea cotyledons (Ballesteros and Walters, 2011; blue Xs) are provided for comparative purposes. Signal size was calculated from Δ tan δ functions as indicated in Figure 3C. The lines represent regression relationships calculated for all water contents except for soybean axes in (A), where regressions were calculated separately for water contents ≥ and ≤0.05 g H2O g–1 dw. All regressions were significant (P > 0.05). Slopes for the size of α relaxation were similar in pea and soybean embryonic axes at water contents ≥0.05 g H2O g–1 dw (P > 0.05) and for β relaxation were similar for all tissues.

