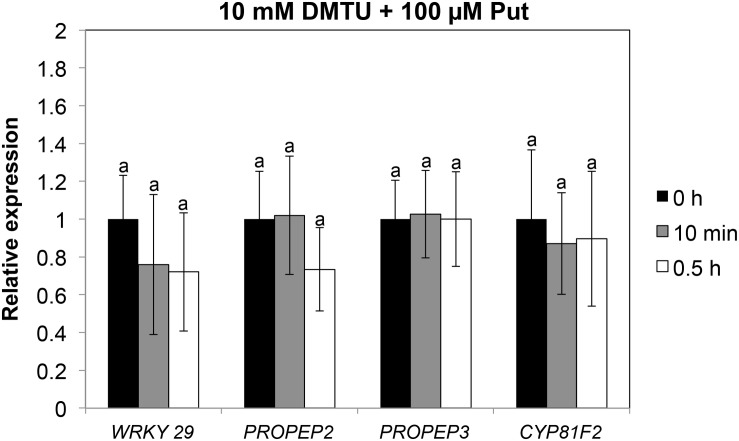
FIGURE 5.
Expression analyses of PTI marker genes in response to 100 μM Put in the presence of 10 mM DMTU. Ten-day-old wild-type seedlings grown in vitro on a nylon mesh in ½ Murashige and Skoog media were transferred to the same media containing 10 mM DMTU for 3 h before treatment with 100 μM Put + 10 mM DMTU or 10 mM DMTU. Samples were collected after 0 h, 10 min, and 0.5 h of Put treatment for expression analyses of WRKY29, PROPEP2, PROPEP3, and CYP81F2 by qRT-PCR. Expression values are relative to DMTU treatment at each time point of analysis. Results are the mean of three biological replicates ± SD (standard deviation). Letters indicate values that are significantly different according to Student–Newman–Keuls test at P value <0.05.

