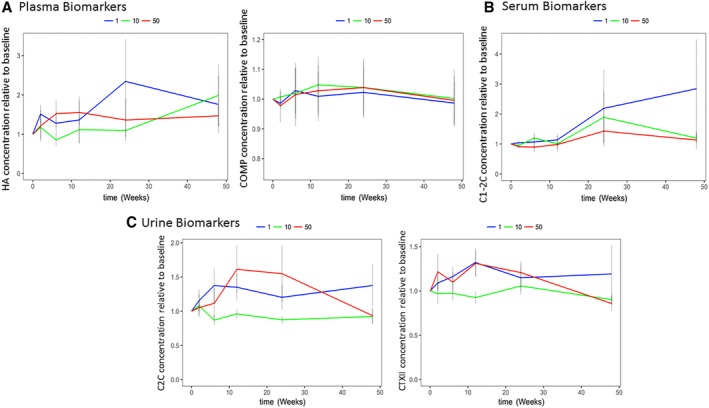
Figure 3.

Changes in plasma, serum, and urine biomarkers after mesenchymal stromal cell (MSC) injection. (A): Plasma HA and COMP. (B): Serum C1‐2C. (C): Urine CTXII and C2C. (A–C): Data are shown as fold change relative to baseline (before MSC injection) at 2, 6, 12, 24, and 48 weeks after MSC treatment. Error bars represent SEM. Blue line, 1 million MSC dose; green line, 10 million MSC dose; red line, 50 million MSC dose. Statistics related to this figure are shown in Table 1. No significant differences were seen using pairwise comparisons of baseline versus 12 months; thus, no statistics are shown on the graphs. Abbreviations: C1‐2C, collagen type I and II cleavage; C2C, cleavage product specific to type II collagen; COMP, cartilage oligomeric matrix protein; CTXII, C‐terminal crosslinked telopeptide type II collagen; HA, hyaluronan.
