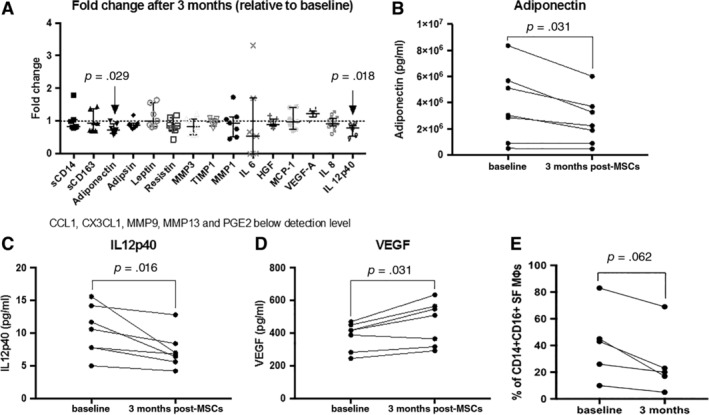
Figure 4.

Synovial fluid changes 3 months after MSC treatment. (A): Only a few of the factors characterized in SF changed after MSC treatment. Fold change in SF soluble factors concentration after MSC treatment is displayed; dotted line indicates levels at baseline. Friedman test with Dunn's test as post hoc was used for identifying significant changes (n = 7). (B, C): Levels of adiponectin (B) and IL12p40 (C) in SF decrease after MSC treatment (n = 7). (D): Levels of VEGF increase after MSC treatment (n = 7). (E): Pro‐inflammatory CD14 + CD16+ monocyte/macrophages tend to decrease after MSC treatment (n = 5). (B–E): p values shown for Wilcoxon signed‐rank test. Abbreviations: CCL1, chemokine (C‐C motif) ligand 1; HGF, hepatocyte growth factor; IL, interleukins; MCP‐1, monocyte chemoattractant protein 1; MMP, matrix metalloproteinases; MSC, mesenchymal stromal cell; PGE2, prostaglandin; TIMP, tissue inhibitor of metalloproteinases; VEGF, vascular endothelial growth factor.
