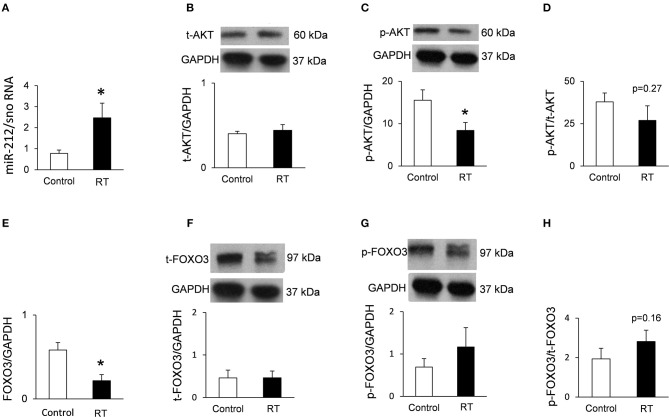
Figure 4.
qRT-PCR and Western blot results at week 19. (A) Cardiac miR-212 expression, (B) cardiac total AKT expression, (C) cardiac phospho-AKT expression, (D) cardiac phospho-AKT/total AKT ratio, (E) cardiac FOXO3 mRNA expression, (F) cardiac total FOXO3 expression, (G) cardiac phospho-FOXO3 expression, and (H) cardiac phospho-FOXO3/total FOXO3 ratio. White bars represent control group and black bars represent the irradiated group. RT means radiotherapy. Values are means ± SEM, n = 7–8, *p < 0.05. In case of Western blot results, only the representative blot image was shown, and the mean was calculated.

