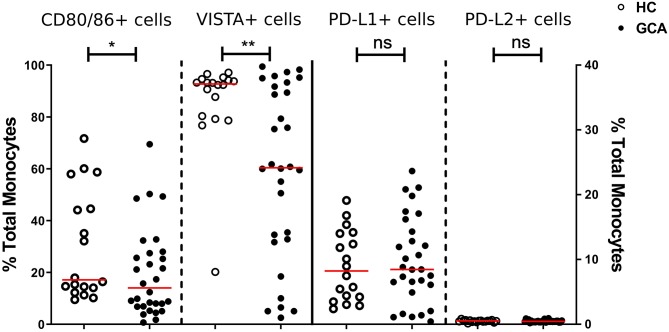
Figure 1.
Frequencies of immune checkpoint molecule expressing circulating monocytes of GCA patients and HCs. Frequencies of peripheral monocytes expressing CD80/86 and VISTA (plotted on left y-axis) were decreased in GCA patients (n = 30) compared with HCs (n = 18). Frequencies of peripheral monocytes expressing PD-1 ligands (PD-L1 and PD-L2) (plotted on right y-axis) were comparable between GCA patients and HCs. The red horizontal lines represent the median. Significant differences by the Mann-Whitney U-test are indicated: *P < 0.05, **P < 0.01, ns, non-significant.

