Figure 2.
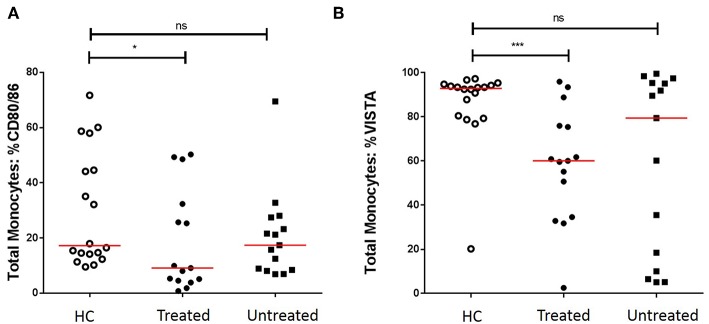
Effect of GC treatment on CD80/CD86 and VISTA-expressing monocytes. (A) Decreased proportions of CD80/CD86+ circulating monocytes of treated GCA patients, no differences between untreated GCA patients and HC. (B) Decreased proportions of VISTA+ circulating monocytes of treated GCA patients, no differences between untreated GCA patients and HC (HC: n = 18, GCA treated: n = 15, and GCA untreated: n = 15). The red horizontal lines represent the median. Significant differences by the Mann-Whitney U-test are indicated: *P < 0.05, ***P < 0.001, ns, non-significant.

