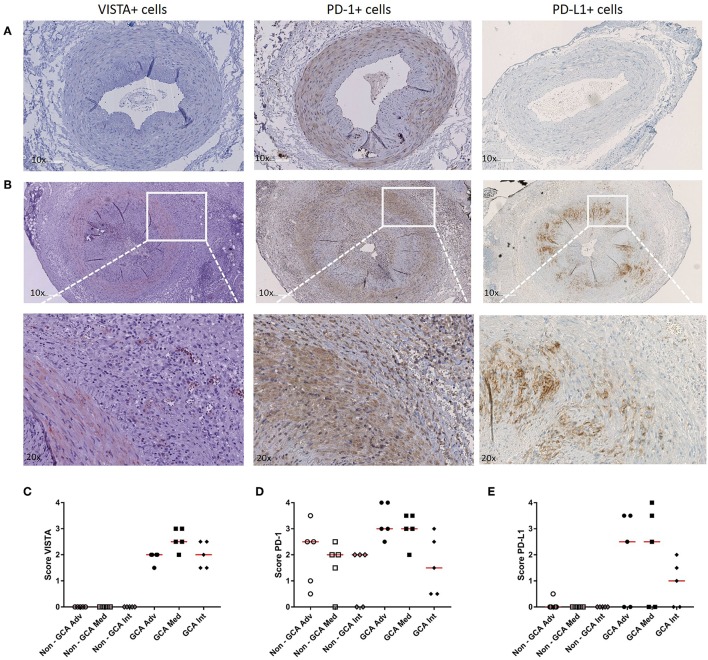
Figure 5.
Increase in VISTA+, PD-1+, and PD-L1+ cells in temporal artery biopsies of GCA patients. (A) Immunohistochemical staining for VISTA, PD-1, and PD-L1 in non-GCA temporal artery biopsies (TABs) and (B) in representative TABs diagnostic of GCA. (C–E) Semi-quantitative mean scores of VISTA+, PD-1+, and PD-L1+ cells in inflammatory areas of GCA TABs (n = 5) and non-GCA TABs (n = 5). Scores are given for the adventitia (Adv), media (Med, infiltrating cells only), and intima (Int). Data are presented as scatter plots. The horizontal red lines represent the median.

