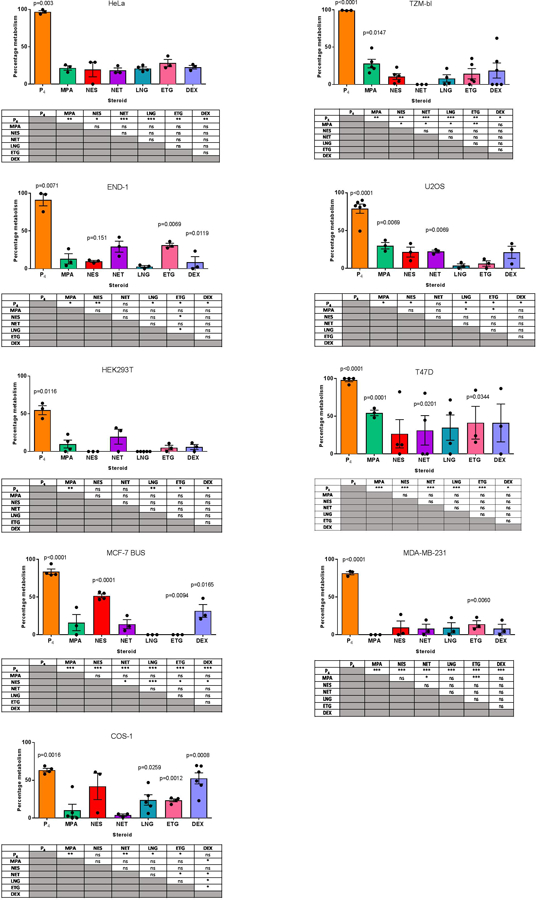
Figure 3. Differential metabolism of seven clinically-relevant steroids following incubation at 100 nM for 24 hours in nine different cell lines.

Medium containing the steroids (no cells) was added to a 12-well plate as a negative control for metabolism. Steroids were extracted and analysed by UHPSFC-MS/MS. The amount of steroid present in the medium after incubation with the cells was expressed as a % relative to the amount of progestin in the negative control for metabolism, which was set as 100%. These data show the mean ± SEM of a minimum of three independent biological repeats. Statistical analysis via paired t-tests was performed on each steroid and statistically significant differences relative to its no cell control are indicated by the p-value above bar. To quantify whether the relative metabolism of two steroids within a cell line was significantly different, multiple t-tests were performed between steroids. Significant differences in tables below the histograms are indicated by asterisks where *, **, ***, **** represent p<0.05, p<0.01, p<0.001 and p<0.0001, respectively.
