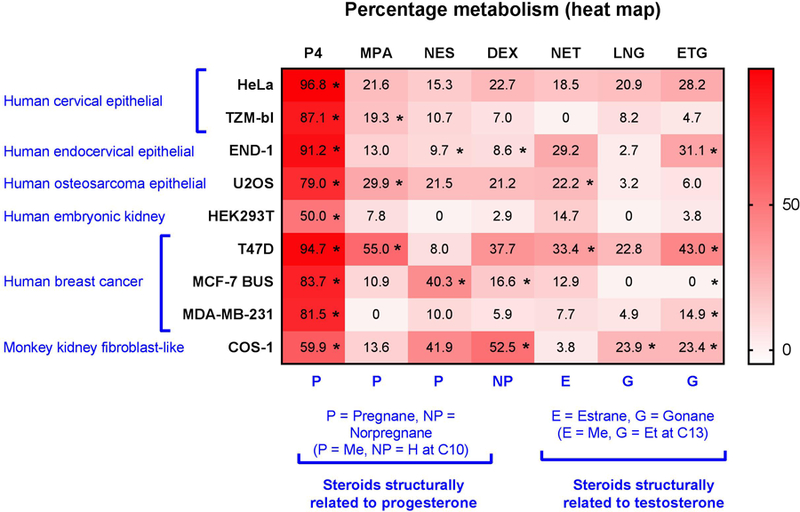
Figure 4. Heat map summarising differential metabolism of seven clinically-relevant steroids.

Data are from Figure 3 and cell lines and steroids are grouped according to anatomical and structural similarities, respectively. Pregnanes (P) have a methyl group at C10 position, while norpregnanes (NP) have a hydrogen group at C10; estranes (E) have a methyl group at C13, while gonanes (G) have an ethyl group at C13. Data is represented as % metabolism relative to the no-cell control which was set to 100%. Statistical significance is indicated by *s.
