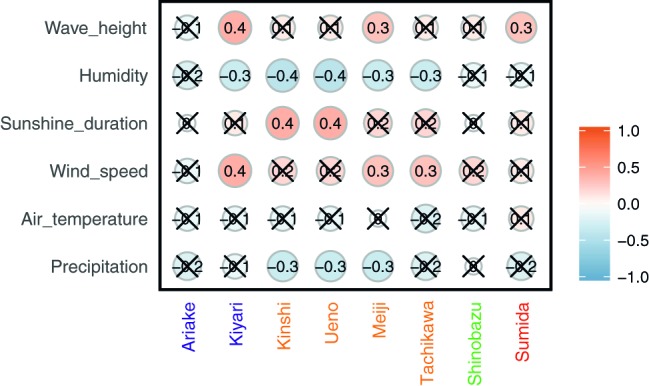
Figure 6.

Spearman’s correlation between estimated source contribution and meteorological factors and wave height in Tokyo Bay. A red/orange circle shows positive correlation and a blue circle shows negative correlation. Cross “X” on the circle indicates no significance (p < 0.05).
