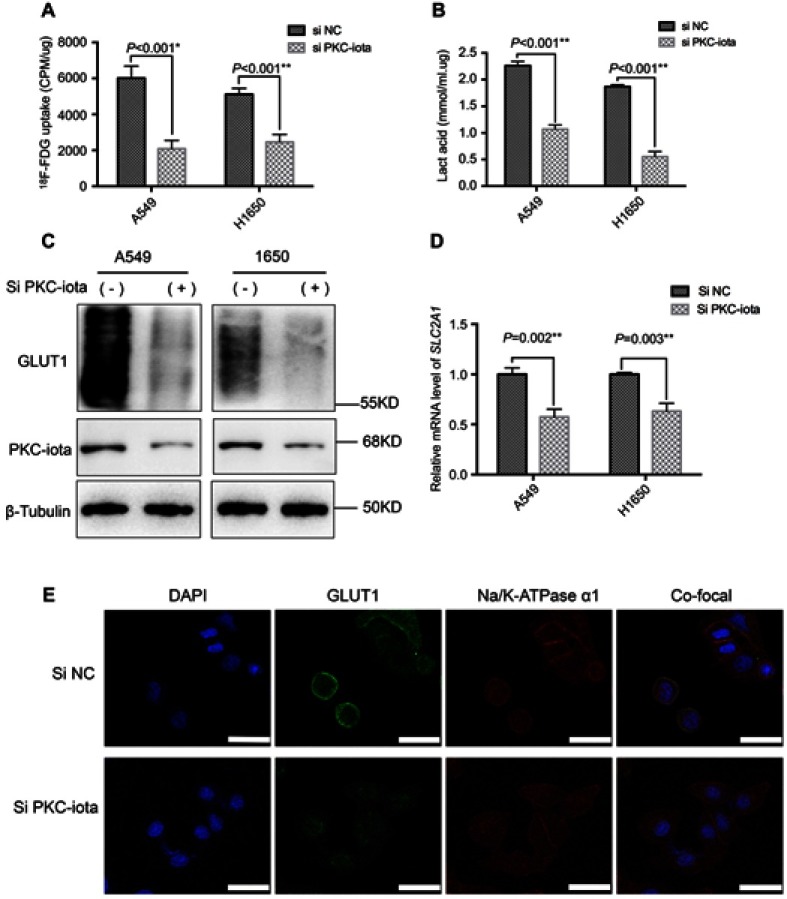
Figure 2.
PKC-iota knockdown reduces 18F-FDG uptake and GLUT1 expression. (A) A549 and H1650 cells were transfected with Si NC or Si PKC-iota for 72 h, after which time 18F-FDG uptake of the indicated cells was detected (CPM: counts per minute). (B) A549 and H1650 cells were transfected with Si NC or Si PKC-iota for 72 h, after which time lactic acid production of the indicated cells was detected. (C) A549 and H1650 cells were transfected with Si NC or Si PKC-iota for 72 h. Then, the cell lysates were immunoblotted with antibodies against PKC-iota and GLUT1. β-Actin served as the loading control. (D) A549 and H1650 cells were transfected with Si NC or Si PKC-iota for 36 h. The mRNA levels of SLC2A1 were analyzed by real-time PCR. (E) A549 cells were transfected with Si NC or Si PKC-iota for 72 h before IF staining. Staining for DAPI (blue), GLUT1 (green), Na/K-ATPase α1 (red) and the overlays of three channels (the membrane localization of GLUT1 are shown in yellow) are shown in the first, second, third, and fourth lines, respectively (scale bar, 25 μm).

