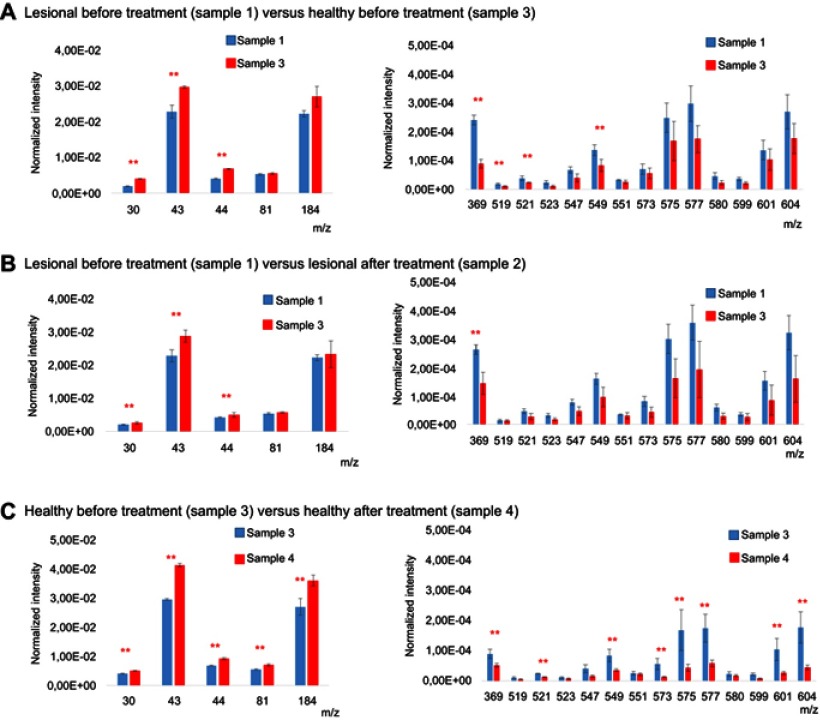
Figure 4.
Intensity histograms from time-of-flight secondary ion mass spectrometry measurements on the dermis region in skin tissue from untreated lesional and healthy and NBUVB-treated lesional and healthy biopsies. Normalized intensity for collagen species at m/z 30, 43, 44, and 81, for phosphatidylcholine head group at m/z 184, for cholesterol at m/z 369 and diacylglycerol lipid species, in (A) lesional sample 1 (blue) vs healthy sample 3 (red), (B) lesional sample 1 (blue) vs NBUVB-treated lesional sample 2 (red), and (C) healthy sample 3 vs NBUVB-treated healthy sample 4. In all charts, the bar heights show the average value and the error bars show 95% CI for each peaks from three regions of interest on the dermis region of each skin tissue section.
Abbreviation: NBUVB, narrowband ultraviolet B.

