Figure 5.

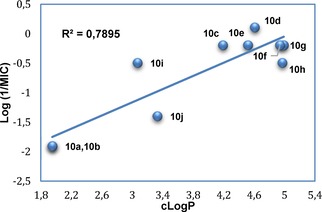
Hansch analysis illustrating correlation between MIC and calculated LogP23 values for the Series 1 and 3 imidazole compounds (10).

Hansch analysis illustrating correlation between MIC and calculated LogP23 values for the Series 1 and 3 imidazole compounds (10).