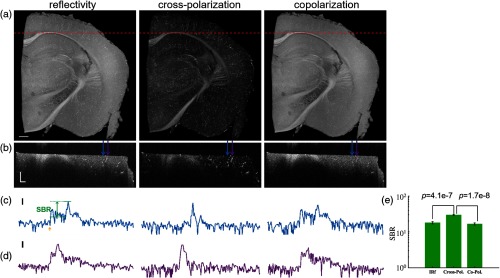
Fig. 1.
PS-OCT contrasts of a mouse brain with particles in the vasculature. (a) En-face coronal images are with mean values of corresponding contrasts over a depth of . (b) Cross-sectional images; red dashed lines in (a) indicate the location. (c), (d) Representative depth profiles; blue and purple arrows in (b) mark the locations; yellow arrow indicates the surface, and SBR is signal-to-background ratio. (e) Mean and s.e.m. of SBR. Scale bars: in (a), in (b), and 10 dB in (c) and (d).

