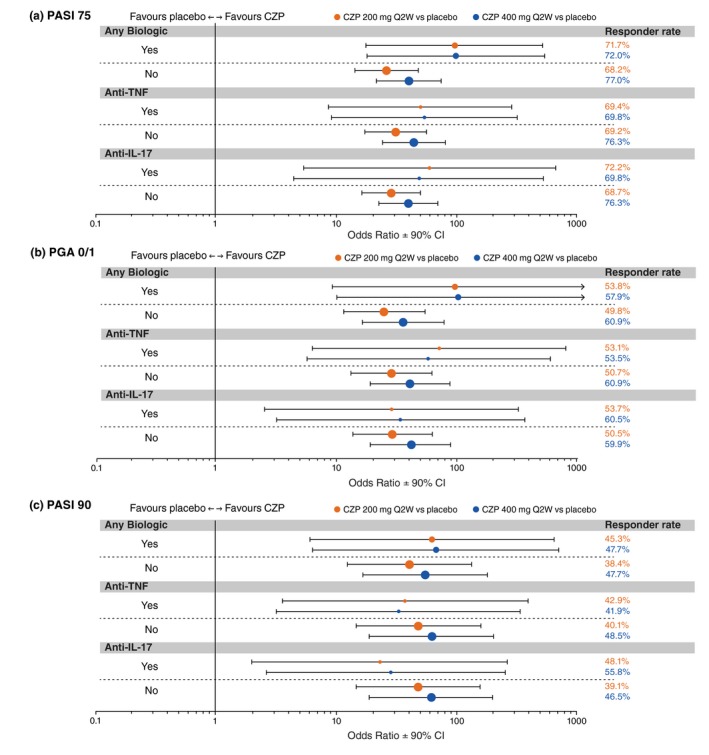
Figure 2.

Forest plots of response rate odds ratios at week 16 in patient subgroups by prior biologic exposure (randomized set). Randomized set includes all randomized patients. Point size is proportional to the size of the subgroup. Responder rates were summarized descriptively applying non‐responder imputation for missing data; the treatment by prior biologic exposure interaction was analysed using a logistic regression model with factors of treatment group, region, study, prior biologic exposure (yes/no), and the interactions study × region and study × prior biologic exposure (yes/no); for the analysis of subgroup interactions between treatment group and prior treatment with anti‐TNF or anti‐IL‐17, terms for subgroup and treatment × subgroup interaction were added to the model; Firth's penalized maximum likelihood estimation was performed to reduce bias in the parameter estimates for ‘Anti‐IL‐17’ for PASI 75 response, and for ‘Any Biologic’, ‘Anti‐TNF’, and ‘Anti‐IL‐17’ for PGA 0/1 and PASI 90 response. CI, confidence interval; CZP, certolizumab pegol; IL, interleukin; PASI 75, ≥75% reduction in psoriasis area and severity index; PGA 0/1, ‘clear’/‘almost clear’ with ≥2‐category improvement in physician's global assessment; Q2W, every 2 weeks; TNF, tumour necrosis factor.
