
Figure 3.
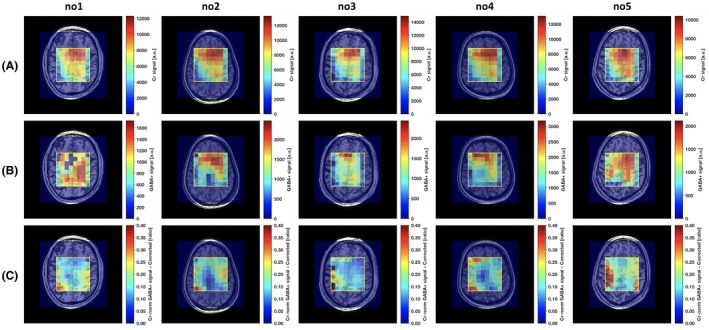
Spatial distributions for the healthy volunteer test scans (no. 1‐no. 5) of the OFF‐pulse measurement creatine (Cr) signal (row A), uncorrected GABA+ signal (row B), and Cr‐normalized GABA+ signal after editing efficiency correction and choline peak frequency and phase alignment (row C)