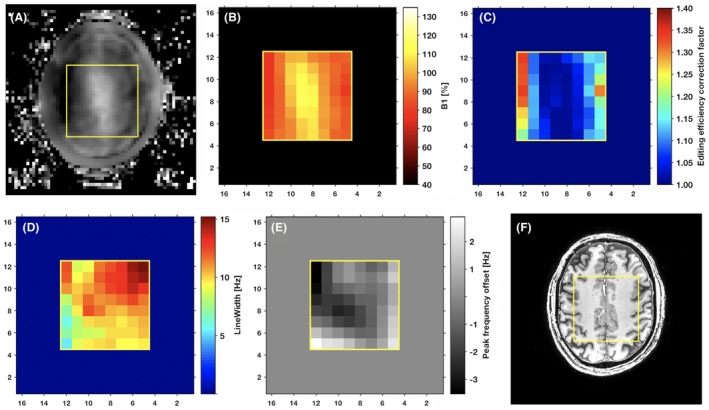
Figure 4.

Spatial distribution for a healthy volunteer test scan (no. 1) of the normalized B 1 field strength as measured over the entire image plane (A); as resampled to the spatial resolution of the EPSI MEGA‐sLASER sequence, used in calculation of the EE correction (B); and the corresponding spatial distribution of the EE correction factor (C). The corresponding spatial distribution of the intravoxel B 0 inhomogeneity by creatine peak linewidth (D) and the intervoxel B 0 inhomogeneity by creatine peak frequency offset (E) are displayed together with the structural scan (F)
