
Figure 5.
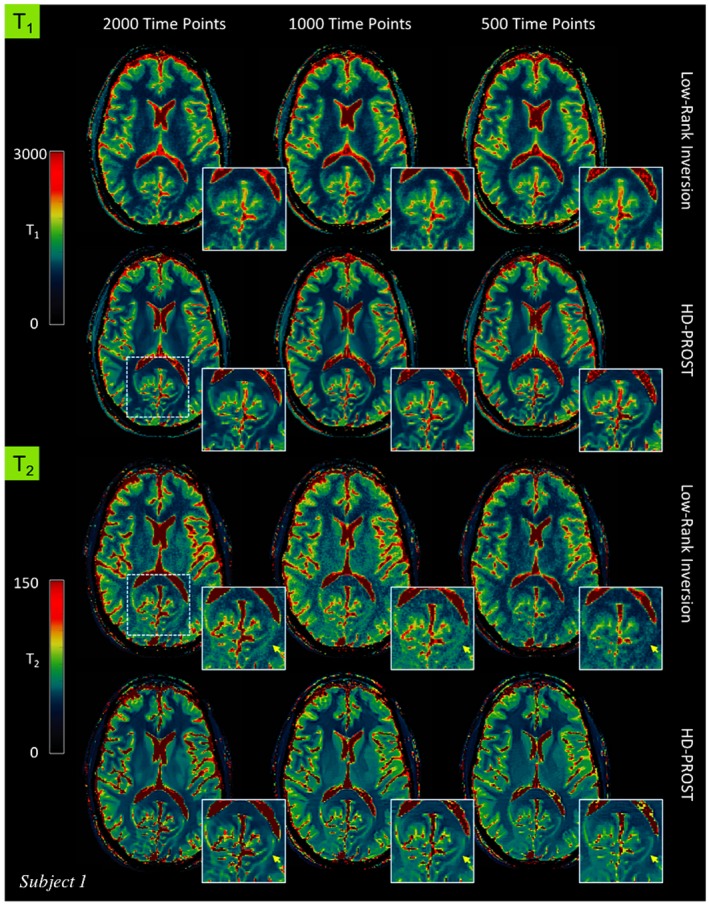
In vivo MRF‐derived quantitative T1 (top) and T2 (bottom) maps for subject 1 reconstructed with low‐rank inversion (LRI) MRF and the proposed HD‐PROST reconstruction with 2000, 1000, and 500 time points
Official websites use .gov
A
.gov website belongs to an official
government organization in the United States.
Secure .gov websites use HTTPS
A lock (
) or https:// means you've safely
connected to the .gov website. Share sensitive
information only on official, secure websites.
In vivo MRF‐derived quantitative T1 (top) and T2 (bottom) maps for subject 1 reconstructed with low‐rank inversion (LRI) MRF and the proposed HD‐PROST reconstruction with 2000, 1000, and 500 time points