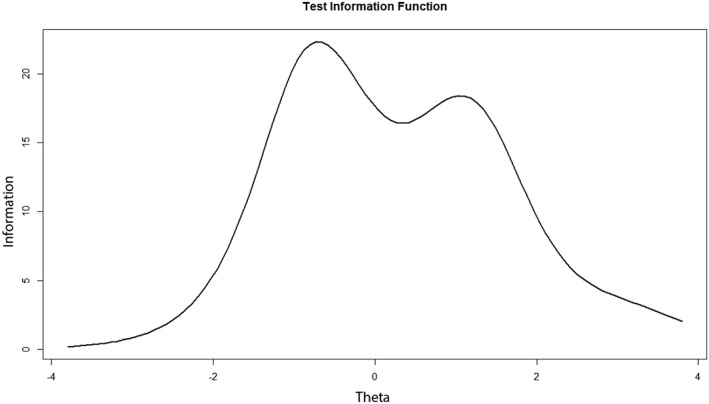
Figure 1.

The total information curve of all items (n = 39) shows the total test information along the trait (with Y = Ii (θ) * the number of items in the test) and provides data on where test information is scarce.

The total information curve of all items (n = 39) shows the total test information along the trait (with Y = Ii (θ) * the number of items in the test) and provides data on where test information is scarce.