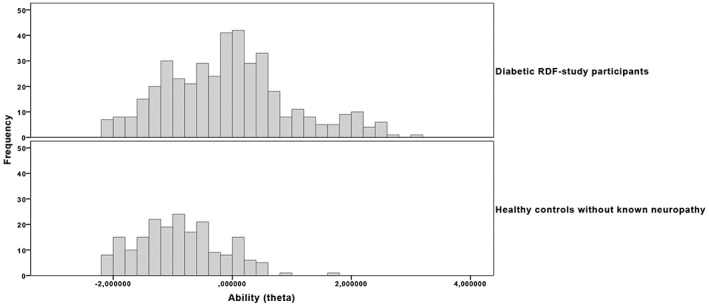
Figure 3.

Comparison between diabetic subjects and controls. Histograms of theta estimates in both groups show that median theta scores (interquartile range) differed significantly between individuals without known neuropathy (‐0.924 [0.94]) and subjects with diabetes (‐0.088 [1.37]), P < 0.0005. Control subjects may experience some aberrancy in S2PD and M2PD items, but generally do have intact vibration sensation and protective sensation, compared with diabetic subjects.
