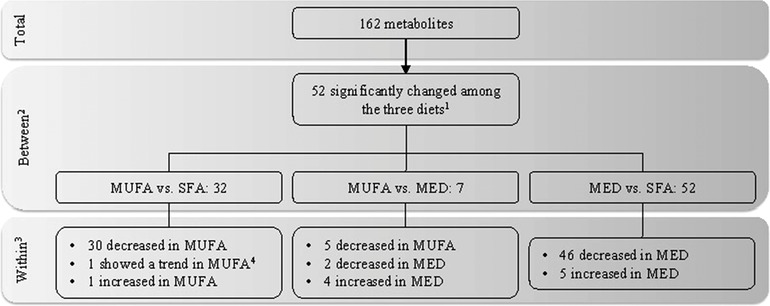
Figure 2.

Significantly changed metabolites upon the three intervention diets. This flow diagram shows the number of metabolites of which the change in concentration was significantly different among the three diet groups. Main effects of the diet × time interaction were tested with an 1ANOVA with an FDR correction (FDR p < 0.05). 2Linear mixed model on the differential changes between the diet groups (p < 0.05), on the metabolites that passed the F‐test. 3Results of the within‐diet group changes were tested with a paired t‐test (FDR p < 0.05). 4FDR p‐value = 0.052 in the within‐diet test. Abbreviations: Mediterranean (MED), saturated fatty acid (SFA).
