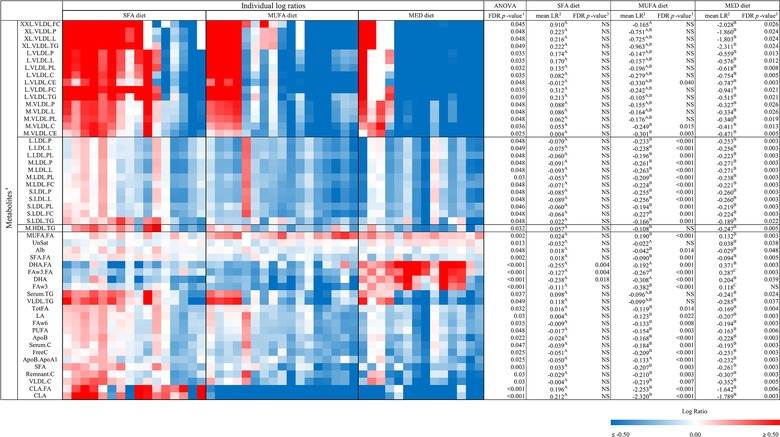
Figure 5.

Heat map of the 52 significantly changed metabolic parameters between the three intervention diets, tested with an a) ANOVA with an FDR correction (FDR p < 0.05). Differences between two diet groups (p < 0.05) tested with a linear mixed model, are indicated with a superscript letter in the corresponding row. Individual changes are indicated as individual log ratios (LR) of values after the intervention versus before the intervention, in the SFA diet group (n = 16), MUFA diet group (n = 17), and the MED diet group (n = 14). These changes are presented on a color scale ranging from blue (decreased, LR ≤ −0.50) to red (increased, LR ≥ 0.50). Subjects are clustered within the diets (Euclidian distance and average linkage). b) Mean log ratios per diet group. c) Corresponding FDR‐corrected p‐values, as tested with a paired t‐test. Abbreviations: log ratio (LR), Mediterranean (MED), saturated fatty acids (SFA).
