
Figure 4.
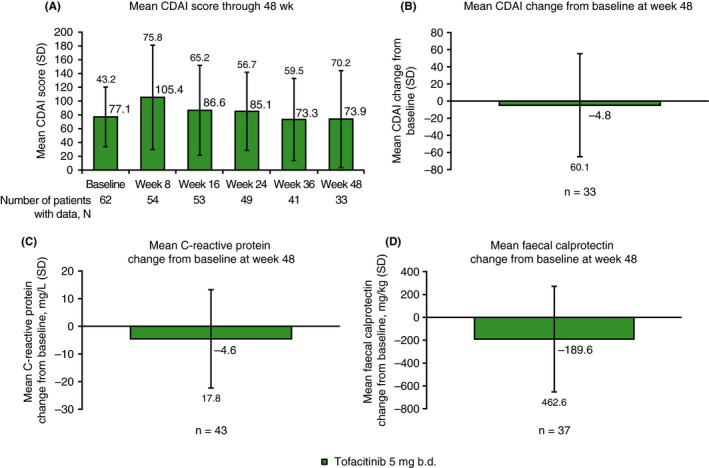
A, Mean CDAI score through week 48, and mean changes from baseline at week 48 for B, CDAI, C, C‐reactive protein and D, faecal calprotectin, for tofacitinib 5 mg b.d. All data represent full analysis set (observed). N represents the total number of patients analysed at each time point, n represents the number of patients with data at week 48 or at baseline and week 48. b.d., twice daily; CDAI, Crohn's disease activity index; SD, standard deviation