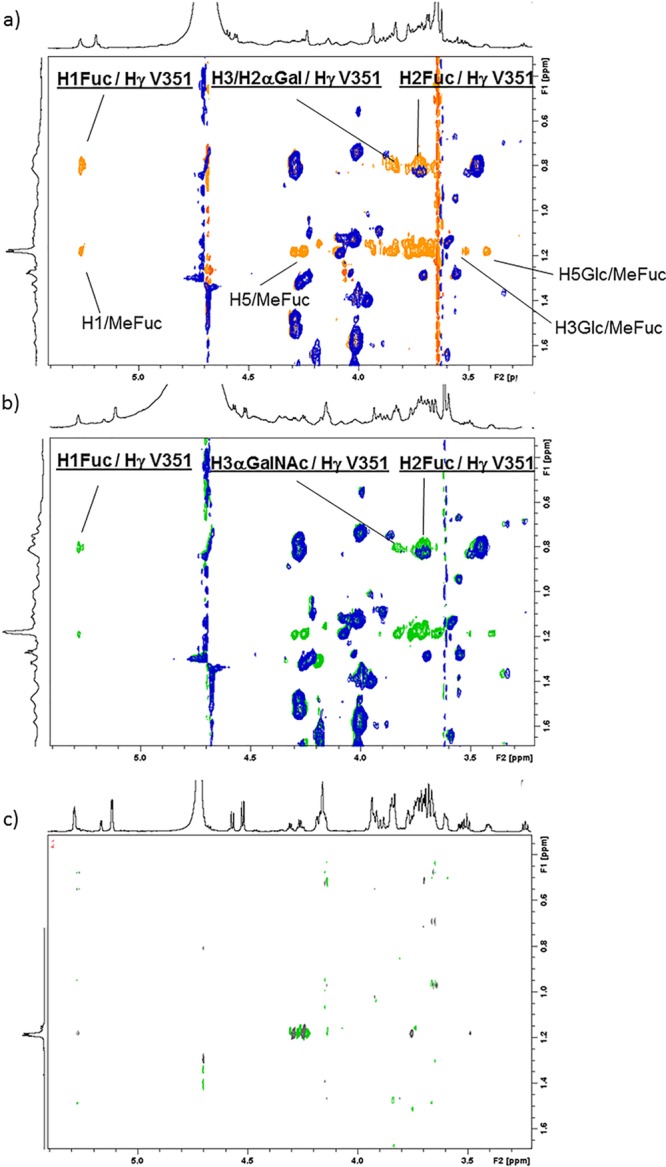
Figure 3.

Quest of protein/ligand intermolecular NOEs. (a) Superimposition of: the NOESY of the CRD of DC-SIGN (blue), and the trNOESY of the complex of the CRD DC-SIGN with 2 (lectin/ligand molar ratio = 1/5, orange). The new crosspeaks in the orange spectrum correspond to intramolecular NOE of the ligand (all those from MeFuc, some of which are annotated) and intermolecular NOE (underlined). (b) Superimposition of the NOESY of the CRD of DC-SIGN (blue), and the trNOESY of the complex of the CRD DC-SIGN with 1 (lectin/ligand molar ratio = 1/5, green). (c) NOESY spectrum of tetrasaccharide 1. All spectra were acquired at 298 K at 800 MHz and with 400 ms of mixing time.
