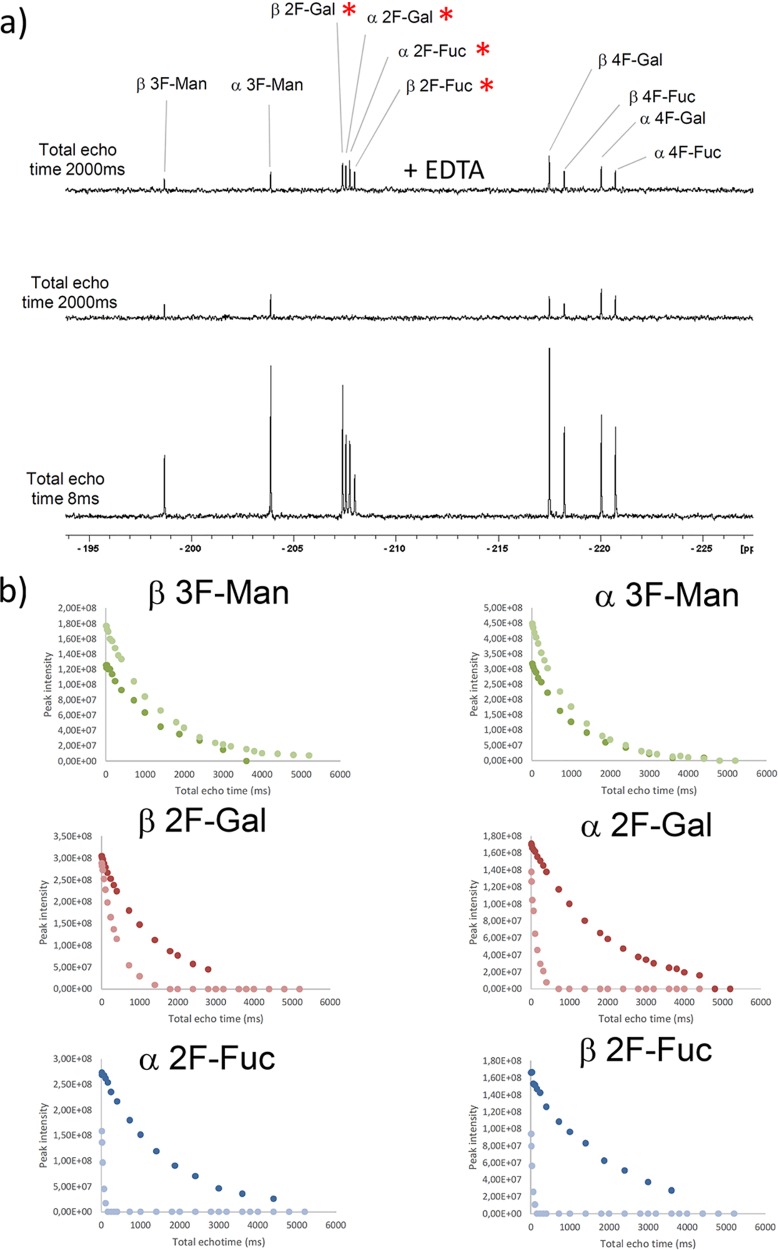
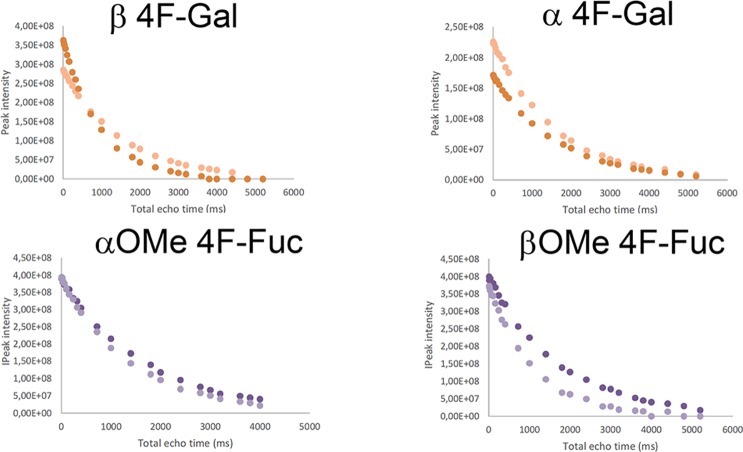
Figure 4.
19F CPMG experiments for the fluorinated monosaccharide small library. (a) The employed concentrations were 40 μM CRD DC-SIGN and 0.8 mM of each monosaccharide. [(Bottom) The first spectrum was acquired with 8 ms total echo time; (middle) the spectrum was acquired with 2000 ms echo time; (top) the spectrum with 2000 ms echo time after the addition of 20 mM EDTA-d12. The red asterisks highlight those 19F signals whose T2 values show a faster decay.] (b) Representation of the 19F T2 decay curves obtained for every species in the mixture, in the absence (dark color) and the presence of DC-SIGN (light color).


