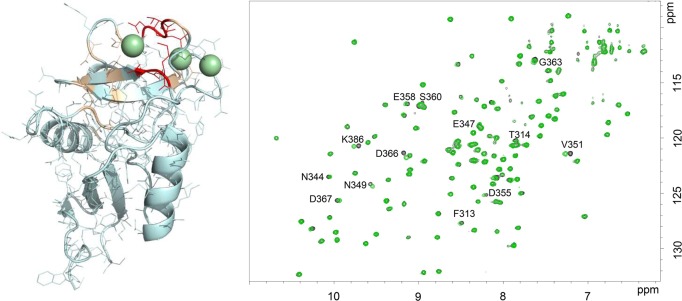
Figure 6.
1H–15N HSQC spectra recorded for the CRD of DC-SIGN without ligand (black) and upon the addition of 40 equiv of compound 3 (green). On the left-hand side, the three-dimensional (3D) structure of the lectin where residues affected by the addition of 3 have been highlighted in wheat, and the most affected ones are shown in red.

