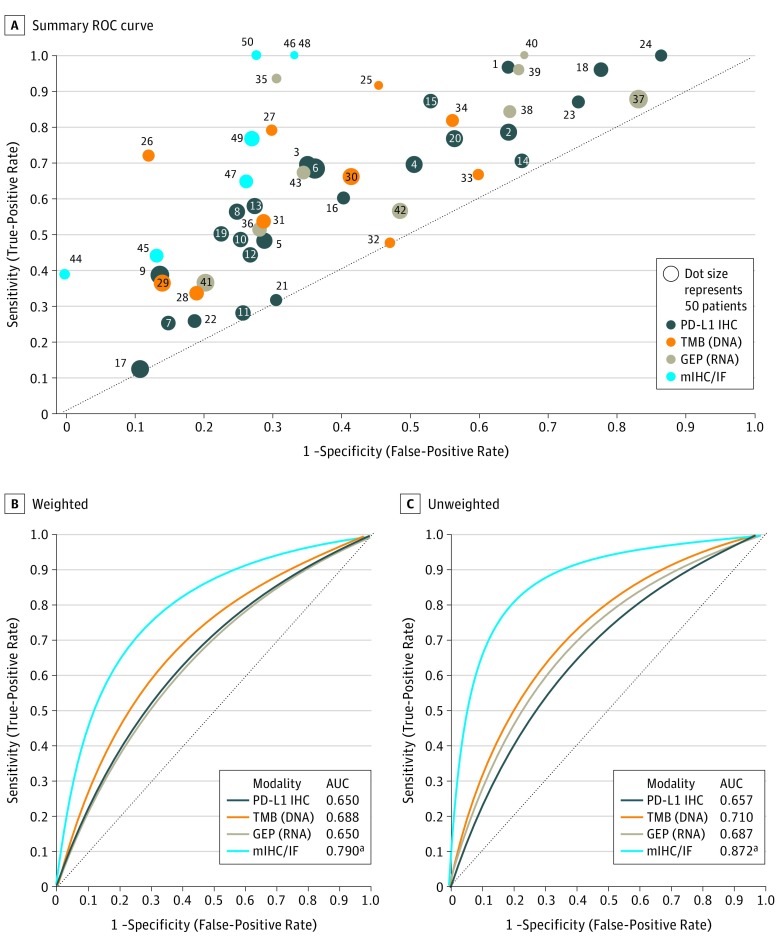
Figure 2. Summary Receiver Operating Characteristic Curve Analysis by Assay Modality for Responders vs Nonresponders.
A, Fifty-six analyses from the primary literature correlating different biomarker modalities with patient responses after anti–PD-1/PD-L1 therapy were analyzed. The sensitivity and 1−specificity of the assay for each individual publication is shown by a single dot (number on the dot correlates with reference list in eTable 1 in the Supplement). The size of each dot is proportionate to the size of the studied cohort. Linear regression models weighted (B) by the number of patients in each study and unweighted (C) (ie, each study treated equally) were used to generate summary receiver operating characteristic [sROC] curves for each assay modality). The multiplex immunohistochemistry/immunofluorescence (mIHC/IF) has a significantly higher area under the curve (AUC) than PD-L1 (programmed cell death ligand 1) IHC, tumor mutational burden (TMB), and gene expression profiling (GEP) by weighted approach and PD-L1 IHC and TMB by unweighted approach.
aIndicates statistical significance (P < .05), Hanley and McNeil method.

