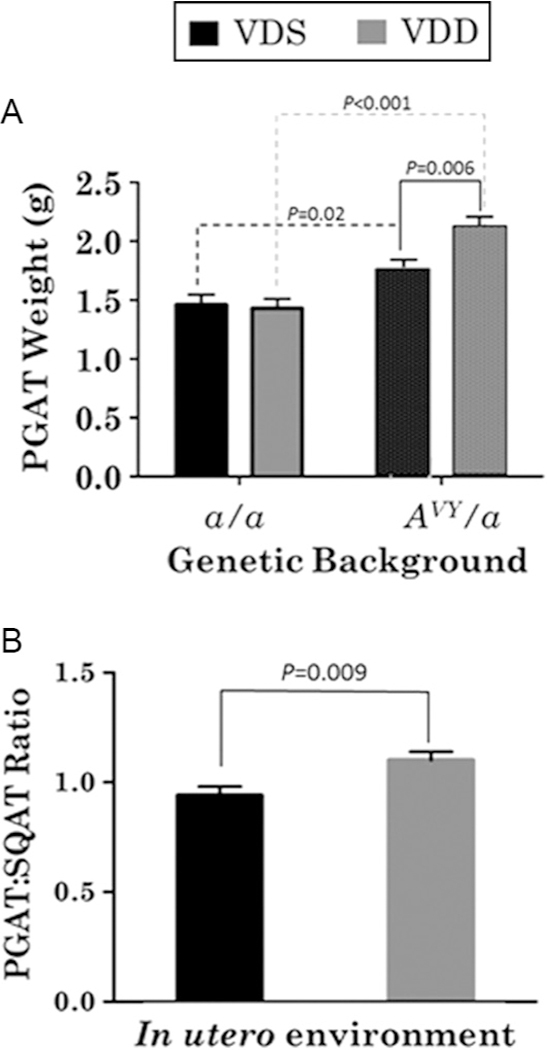
Figure 3.

(A) Perigonadal adipose pad (PGAT) weights. Different shaded bars represent different in utero environment groups. (B) Ratio of perigonadal (PGAT) to subcutaneous (SQAT) adipose tissue weights. Different shaded bars represent different in utero environment groups (i.e., maternal vitamin D status, vitamin D deficient (VDD) or sufficient (VDS)). Data are presented as marginal mean ± s.e.m.
