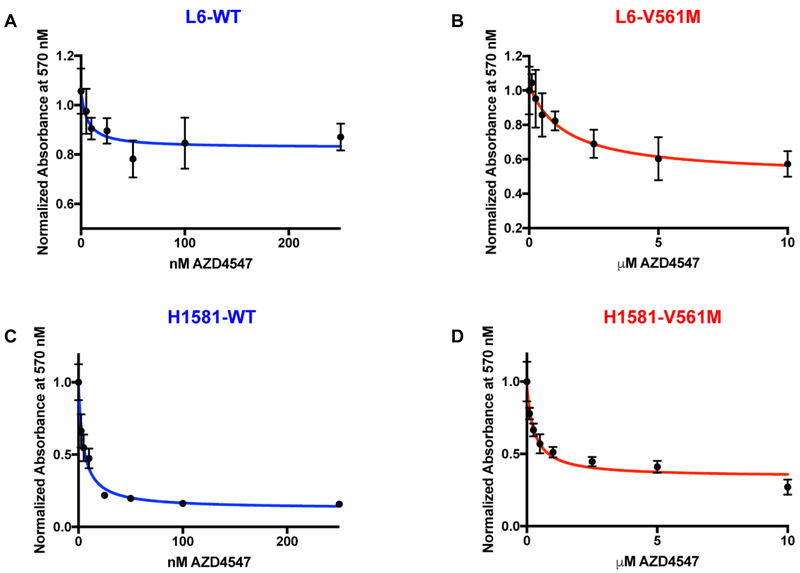
Figure 1: V561M FGFR1 displays dramatic AZD4547 resistance in cell-based assays.
A, B L6 and C, D H1581 cells overexpressing WT or V561M FGFR1 were starved for 12 h and 1000-5000 cells were plated in 96 well plates. After 24 h cells were treated with AZD4547, and after 2-4 days cell viability was quantified using an MTT assay. Cell viability was plotted against [AZD4547] using GraphPad prism before fitting to an inhibition curve to obtain IC50 values.

