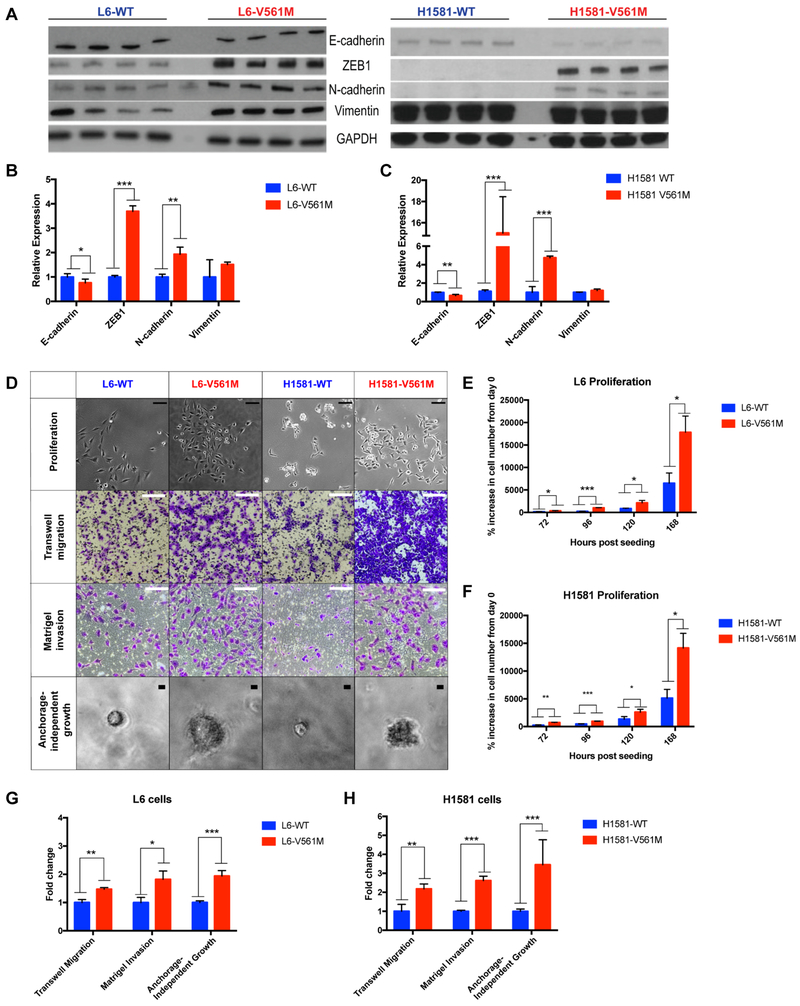
Figure 3: EMT is enhanced in V561M cells relative to WT.
A Basal L6-WT, L6-V561M, H1581-WT and H1581-V561M cells were harvested and lysed, and immunoblots of four replicate lysates were performed as described for 2C. B EMT marker expression in L6-WT, L6-V561M, and C H1581-WT and H1581-V561M cell lines were normalized against loading controls and quantified using ImageJ. Data were plotted using GraphPad Prism. D Representative images of proliferation, transwell migration, Matrigel invasion and anchorage-independent growth in L6 and H1581 cell lines are shown. Scale bars in proliferation images correspond to 100 μm; migration and invasion: 200 μm; anchorage-independent growth: 10 μm E, F Quantification of proliferation of L6 and H1581 cells after 3, 4, 5, and 7 days of proliferation are shown as % cell growth relative to the initial cell count. G, H Transwell migration, Matrigel invasion, and anchorage-independent growth in L6-WT, L6-V561M, H1581-WT, and H1581-V561M were displayed as fold-change of V561M cells relative to WT using GraphPad Prism. Significance values: *<0.05; **<0.01, ***<0.001.

