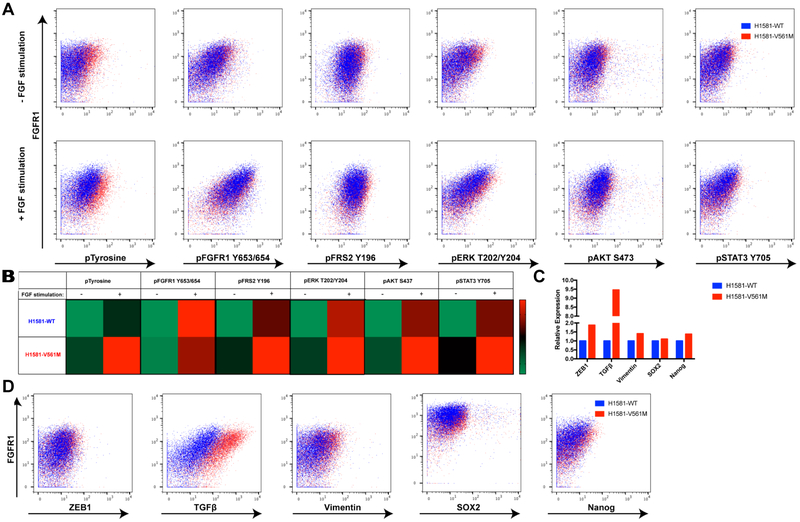
Figure 5: STAT3 upregulation in H1581-V561M cells and mesenchymal marker expression were confirmed using CyTOF.
A 2×10⁶ cells were barcoded before combining unstimulated and stimulated conditions of H1581-WT and H1581-V561M cells together for both surface and intracellular staining. Cells were surface stained, methanol permeabilized, and stained for intracellular antibodies. Pairwise plots showing marker expression vs FGFR1 in each treatment condition were generated using FlowJo software. B Representative heatmaps showing average activation of each signaling partner before and after FGF stimulation in H1581-V561M and H1581-WT were generated using GraphPad Prism. C Representative bar graphs demonstrating EMT and stem cell marker expression were generated using GraphPad Prism. D Pairwise plots showing marker expression vs FGFR1 in each treatment condition were generated using FlowJo software.

