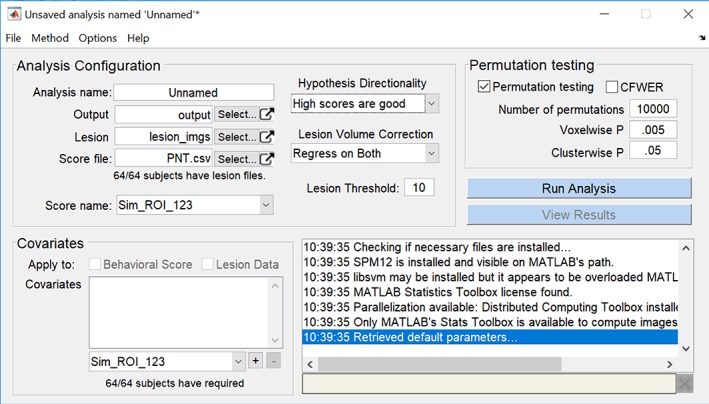
Figure 1.

Screenshot of the MATLAB‐based graphical user interface for SVR‐LSM. The single window contains a pane for configuring an analysis, a pane for configuring covariates, a pane for permutation testing, and a feedback pane that reports the progress of an analysis [Color figure can be viewed at http://wileyonlinelibrary.com]
