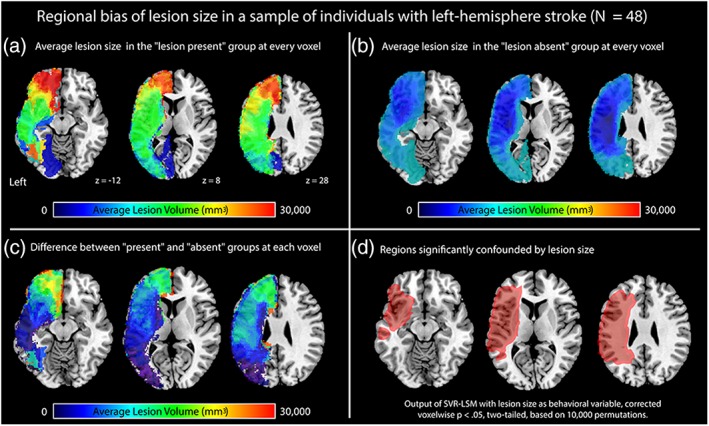
Figure 3.

Figure showing the regional bias caused by lesion volume in a cohort of individuals with left‐hemisphere stroke (N = 48). The panels show maps of average lesion volume in (a) the “lesion present” group at each voxel, (b) the “lesion absent” group at each voxel, and (c) a difference between average lesion volume in the “lesion present” and “lesion absent” groups, and (d) regions where lesion volume was significantly different (red outline, red translucent fill). The analysis displayed in panel d was conducted in SVR‐LSM treating lesion volume as the behavioral variable, thresholded voxelwise at p < .05 (two‐tailed) based on 10,000 permutations [Color figure can be viewed at http://wileyonlinelibrary.com]
