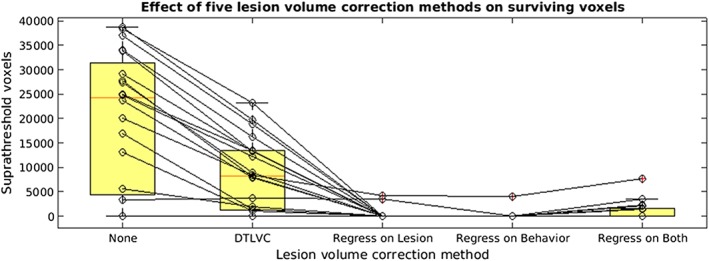
Figure 4.

Spaghetti plot showing the effect of five lesion volume correction methods on twenty behaviors in a group of individuals with left‐hemisphere stroke (N = 49). Lesion volume methods include (a) none, (b) dTLVC, (c), regression of lesion volume out of the raw voxel data, (d) regression of lesion volume out of the behavioral data, and (e) regression of lesion volume out of both behavioral data and out of raw voxel data. All analyses were thresholded at voxelwise at p < .005 (one‐tailed) and clusterwise correction at p < .05, based on 10,000 permutations [Color figure can be viewed at http://wileyonlinelibrary.com]
